| Number of Branches |
36 |
34 |
34 |
| Number of Sub Branches |
114 |
115 |
115 |
| Number of Villages |
12,614 |
12,675 |
12,683 |
| Coverage of total village in Cambodia |
89% |
90% |
90% |
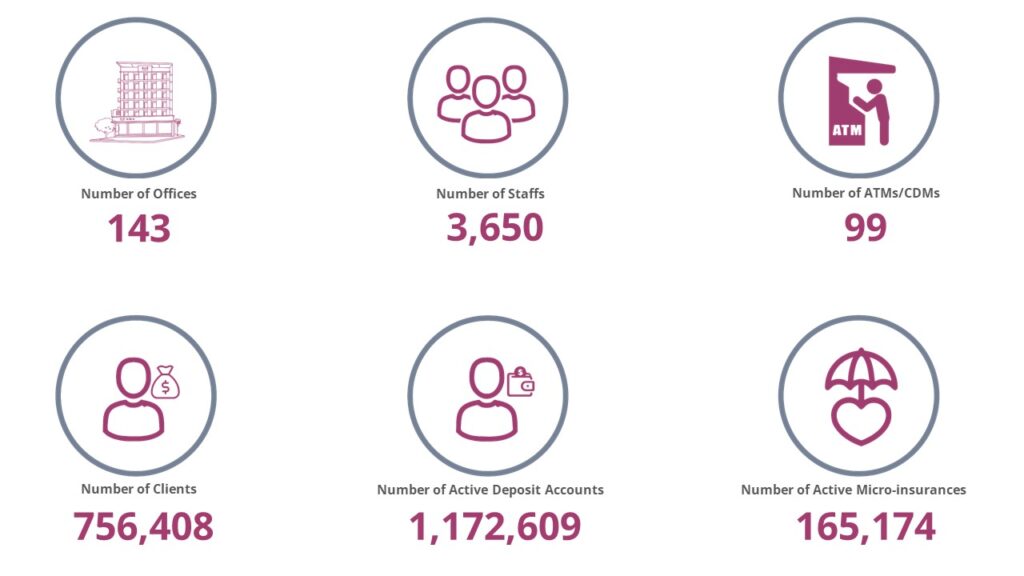
| Number of Staff |
2,811 |
3,091 |
3,163 |
| Client Officers over Total Staff |
35% |
41% |
40% |
| Number of Total Active Client Accounts |
765,058 |
912,113 |
907,871 |
| Number of Active Loan Accounts |
359,681 |
398,465 |
402,441 |
| Group Loan Account |
78% |
74% |
73% |
| Individual Loan Account |
22% |
26% |
27% |
| Loan Portfolio (USD) |
$ 252,910,502 |
$ 326,836,739 |
$ 342,581,819 |
| Group Loans |
44% |
51% |
50% |
| Individual Loans |
56% |
49% |
50% |
| Active Loan Account / Avg. Client Officer |
346 |
315 |
320 |
| Loan Outstanding/Avg. Client Officer (USD) |
$ 239,546 |
$ 258,165 |
$ 272,648 |
| Number of Active Depositor accounts |
793,526 |
1,359,755 |
946,244 |
| Number of Depositors with Outstanding Loan |
388,149 |
380,872 |
402,441 |
| Deposit Balance (USD) |
$ 158,786,976 |
$ 178,882,153 |
$ 178,680,608 |
| Number of ATM / CDM |
61 |
56 |
56 |
| Number of Active Micro Insurance |
285,646 |
328,968 |
334,939 |
| Net Profit (after tax, USD) |
$ 6,659,344 |
$ 7,767,179 |
$ 1,220,534 |
| Operational Self Sufficiency (OSS) |
115.8% |
117.5% |
115.5% |
| Return on Assets (RoA) |
2.1% |
2.0% |
1.7% |
| Adjusted RoA (Less B2B) |
2.2% |
2.2% |
1.8% |
| Return on Equity (RoE) |
15.3% |
13.8% |
10.5% |
| Average Cost of Funds |
6.9% |
6.6% |
6.2% |
| Leverage Ratio (Debt to Equity) |
4.99 |
4.33 |
4.34 |
| PAR 30 Days |
1.09% |
0.86% |
0.91% |
| Write off Ratio |
1.14% |
0.56% |
0.04% |
| Loan Highlights |
| Average Loan Size / GNI per Capita (loan disbursed) |
91.7% |
84.1% |
86.8% |
| Percent of Loans ≤USD 500 |
21.5% |
17.6% |
16.7% |
| Average Outstanding Loan Per Loan Account (USD) |
$ 692 |
$ 820 |
$ 851 |
| Group Loan Account |
$ 518 |
$ 571 |
$ 582 |
| Individual Loan Account |
$ 1,377 |
$ 1,514 |
$ 1,593 |
| Average Loan Disbursed (USD) |
$ 926 |
$ 1,206 |
$ 1,244 |
| Group Loan Account |
$ 662 |
$ 798 |
$ 814 |
| Individual Loan Account |
$ 1,926 |
$ 2,211 |
$ 2,364 |
| Deposit Highlights |
| Average Deposit Balance / GNI per Capita |
19.8% |
9.2% |
9.2% |
| Percentage of Deposits with Balance ≤USD 300 |
97.4% |
98.4% |
98.5% |
| Average Deposit Per Saving Account (USD) |
$ 200 |
$ 132 |
$ 132 |
| Money Transfer Highlights |
| Number of Money Transfer ≤USD 300 |
48,181 |
29,295 |
33,524 |
| Average Transfer Balance/GNI per Capita |
30.5% |
20.7% |
13.4% |
| Other Social Highlights |
| Women Borrowers as Percentage of Total |
81.3% |
81.0% |
80.9% |
| Rural Borrowers as Percentage of Total |
93.1% |
95.0% |
95.1% |
| Drop-out Rate** |
21.6% |
29.4% |
3.6% |
